Ggplot2: Difference between revisions
No edit summary |
|||
| Line 8: | Line 8: | ||
===Bar Chart=== | ===Bar Chart=== | ||
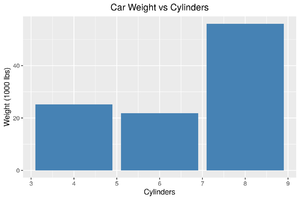
[[File:Ggplot2 barchart example.png|300px|thumb]] | |||
Example bar graph: | |||
<syntaxhighlight lang="R"> | |||
data(mtcars) | |||
library(ggplot2) | |||
ggplot(mtcars, aes(x=cyl, y=wt)) + | |||
geom_bar(stat="identity", fill="steelblue") + | |||
xlab("Cylinders") + | |||
ylab("Weight (1000 lbs)") + | |||
ggtitle("Car Weight vs Cylinders") + | |||
theme_gray() + | |||
theme(plot.title = element_text(hjust = 0.5)) | |||
</syntaxhighlight> | |||
===Line Graph=== | ===Line Graph=== | ||
===Pie Chart=== | ===Pie Chart=== | ||
Revision as of 17:32, 28 October 2020
ggplot2 is a plotting tool for R
Usage
- Resources
Bar Chart

Example bar graph:
data(mtcars)
library(ggplot2)
ggplot(mtcars, aes(x=cyl, y=wt)) +
  geom_bar(stat="identity", fill="steelblue") +
  xlab("Cylinders") +
  ylab("Weight (1000 lbs)") +
  ggtitle("Car Weight vs Cylinders") +
  theme_gray() +
  theme(plot.title = element_text(hjust = 0.5))
